30次元のすべての特徴量でランダムフォレストしてみました。
特徴量2つだけだと寂しかったからね。
前回までのランダムフォレストでは、可視化のために特徴量を2次元に絞って行っていました。今回は、scikit-learnの乳がんデータですべての特徴量を利用してみます。ランダムフォレストの本領を見ていきます。
前回のランダムフォレストに関する記事は、こちらをご参考ください。

こんな人の役に立つかも
・機械学習プログラミングを勉強している人
・ランダムフォレストを勉強している人
・scikit-learnでランダムフォレストをプログラミングしている人
ランダムフォレストで分類問題
普通に分類してみる
全ての乳がんデータの特徴量に対してランダムフォレストで分類します。
まずはimport~乳がんデータを訓練データとテストデータに分割するところまでをブロックとして作成しておきます。
from sklearn.datasets import load_breast_cancer
from sklearn.model_selection import train_test_split
from sklearn.ensemble import RandomForestClassifier
import matplotlib.pyplot as plt
import numpy as np

#乳がんデータ
panda_box = load_breast_cancer()

X = panda_box.data
y = panda_box.target

#訓練データとテストデータに分割
X_train, X_test, y_train, y_test = train_test_split(X, y, test_size = 0.25, stratify=y, random_state=0)ランダムフォレストを作成しています。「n_estimators」のパラメータによって、決定木を何個作成するかを調整できます。
とりあえずの「100」です。random_stateは「0」に固定しておくことで、後から何回実行しても、結果に変化がないようにしています。
clf = RandomForestClassifier(n_estimators=100, random_state=0).fit(X_train,y_train)

print("訓練データへの精度")
print("{:.4f}" .format(clf.score(X_train, y_train)))
print("未知データへの精度")
print("{:.4f}" .format(clf.score(X_test, y_test)))
訓練データへの精度
0.9977
テストデータへの精度
0.9441素晴らしく精度向上している・・・・
次に、n_estimatorsを100としましたが、もっと少なくするとどのようになるかを試します。
パラメータ変更による精度の違いを確認
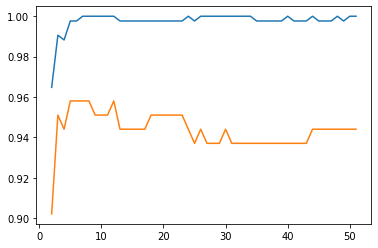
n_estimatorsの部分をループさせて、2~52まで、50パターンの精度を計測してグラフで表示します。
import matplotlib.pyplot as plt
import numpy as np

#50回分の結果を随時追加していくための空のリストを作成
train_dat_array = []
test_dat_array = []

loop_estimator = 50

for i in range(loop_estimator):
    clf = RandomForestClassifier(n_estimators=i+2, random_state=0).fit(X_train,y_train)
    train_dat_array.append(clf.score(X_train, y_train))
    test_dat_array.append(clf.score(X_test, y_test))

X_axis = np.linspace(2,loop_estimator+1,loop_estimator)
plt.plot(X_axis, train_dat_array)
plt.plot(X_axis, test_dat_array)
「loop_estimator」という変数に、試したい「n_estimator」の回数を入れます。50とすると、2~52までのn_estimatorを試します。
for文で、2~52までのn_estimatorを設定したランダムフォレストの訓練データの評価とテストデータへの評価が、それぞれ「train_dat_array」と「test_dat_array」に入っていくので、最後にmatplotlibでグラフ化しています。

X軸がn_estimatorの値、Y軸が精度になります。このようにしてみると、n_estimatorが8の時くらいが訓練データへの精度とテストデータへの精度がピークになり、それ以降は過学習ぎみになっていくことがわかります。
より少ない決定木の数で精度があげられたほうがいいよね
次に、max_featuresを設定してみました。「max-features」パラメータは、特徴量の選択のランダム性に関するパラメータです。「auto」と「sqrt」と「log2」、あとは数値での指定が選択できるみたいです。現段階のscikit-learn0.23では、「auto」と「sqrt」は同じとのことです。また、初期値は「auto」なので、先に試したものは、パラメータ「max_features」を「sqrt」としていることと同じですね。
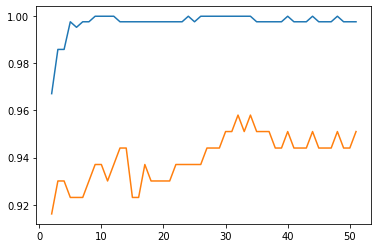
「max_features」を「log2」としたときのプログラムを以下のように実行してみます。
train_dat_array = []
test_dat_array = []

loop_estimator = 50

for i in range(loop_estimator):
    clf = RandomForestClassifier(n_estimators=i+2, random_state=0, max_features="log2").fit(X_train,y_train)
    train_dat_array.append(clf.score(X_train, y_train))
    test_dat_array.append(clf.score(X_test, y_test))

X_axis = np.linspace(2,loop_estimator+1,loop_estimator)
plt.plot(X_axis, train_dat_array)
plt.plot(X_axis, test_dat_array)
なんだかsqrtがいい感じがするね
木が少なくてテストデータへの精度が高いのはsqrtになったね。

